results <- read.csv("data/survey.csv", header = TRUE)
plot(lines ~ experience, results,
     xlab = "experience (years)",
     ylab = "lines of code/day")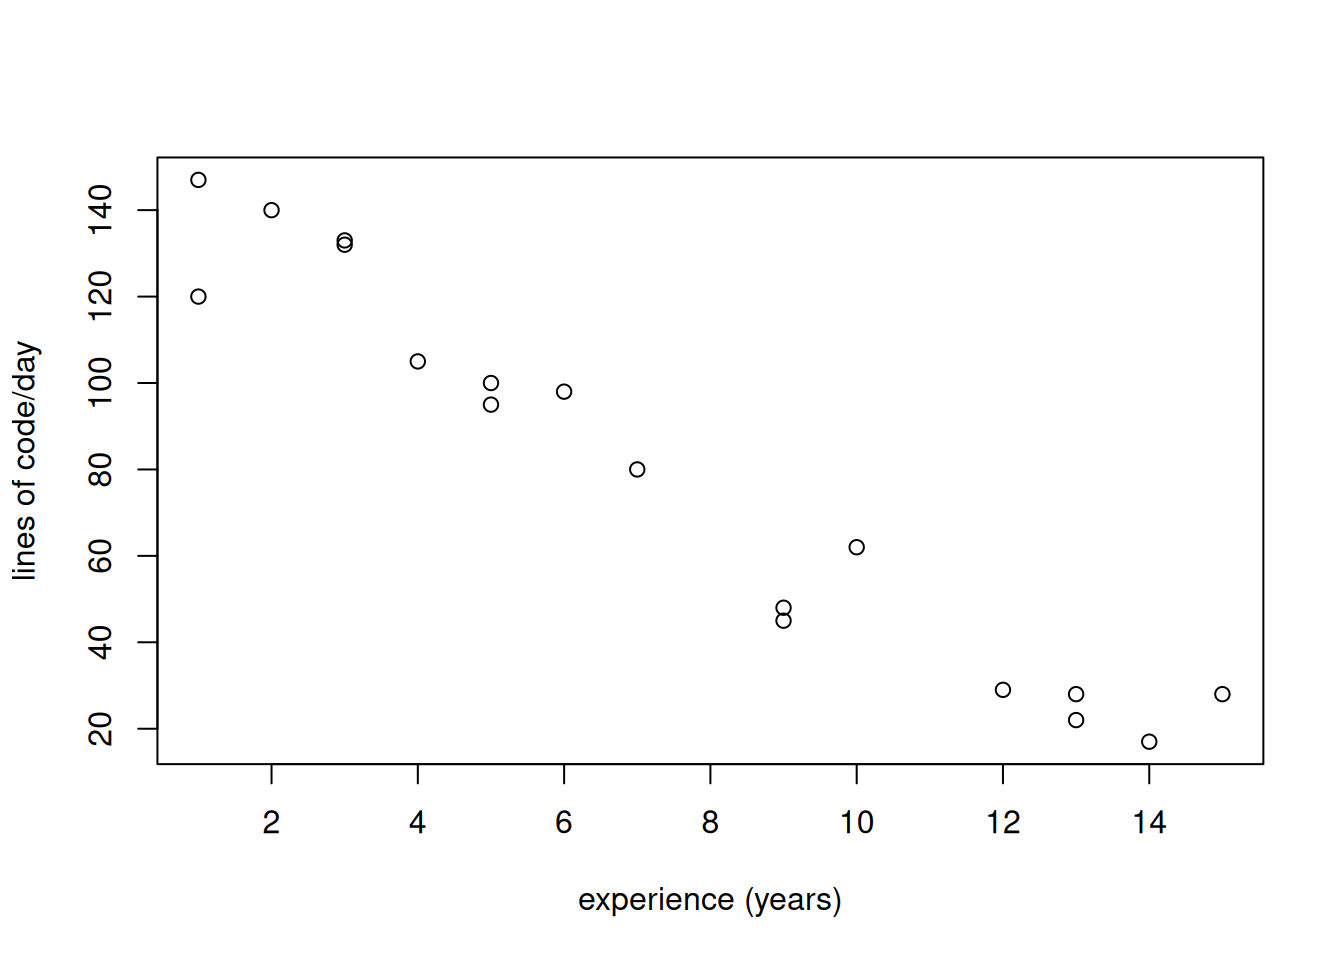
In this chapter, we provide an overview of common research methods that directly involve human subjects. This should not be considered an exhaustive list of strictly defined and clearly separated methods, but rather a selection of typical examples with certain characteristics that can be customized as necessary.
Many of the concepts and principles described here are also usable in purely computer-based studies. For instance, sampling also applies to projects in software repository mining studies, and qualitative coding (assigning tags to parts of text) can be performed on texts from an Internet forum.
Before performing any empirical study with human participants, it is necessary to consider the ethical standpoint of research. Specific rules that apply depend on the institution and country where the research is performed, but there exist several general documents providing general guidelines.
One of them, the Belmont report specifies three basic ethical principles: respect for persons, beneficence, and justice. They imply a number of practical rules.
First, subjects have to know that they are participating in a research study, and their participation has to be voluntary. They should be informed about the general goal of the study. If the knowledge of specific details would affect the validity of research negatively, it can be postponed to the debriefing phase after the study. Deception, i.e., providing outright false information about the purpose of the study, should be used only if absolutely necessary and the true purpose must be revealed during debriefing. Apart from voluntariness, a person has to be able to withdraw from the study at any point.
Second, the benefits must outweigh the risks of the study. This applies both to the individual and society level. For instance, at the individual level, the participants in the study can receive small compensation, such as a voucher, or be informed about the results sooner than the general public if they wish so. At the society level, a slightly higher-risk study is justified if a significant breakthrough is expected thanks to the results, but the risks should not be higher than absolutely necessary and never cross a certain line.
Finally, the sample that will be studied should be selected fairly. For instance, if our research is aimed at professional software engineers, we should not constantly use only students in every experiment because they are conveniently available.
Before conducting research with human subjects, an institutional review board (IRB) approval is required in many cases. An institutional review board is a group of people at an institution, such as a university, who decide whether a given research study is ethical. An IRB application is institution-specific, but generally it contains information about the investigators, a hypothesis or research question, a succinct but complete description of the planned research method, and a sample informed consent document. An informed consent is an agreement of an individual to participate in a study. It is best if it has a written form (electronic or paper-based), since verbal informed consent is difficult to prove. An informed consent should contain:
Research data obtained during research with human participants should be carefully scanned for personal information. All information that could reveal the identity of the participants should be anonymized (or pseudonymized) before publishing. Furthermore, relevant regulations such as the GDPR need to be taken into account.
A survey, in this sense, is a method to collect and analyze data from humans using a questionnaire with a fixed set of questions. This questionnaire can be either paper-based or, very commonly, administered as a web form. The usual purpose is to find certain self-reported information about a population, e.g., the average number of monitors used by professional 3D modelers, or the most common problems Haskell developers face when using monads.
While it is sometimes possible to administer a survey to the whole population, often this is not feasible. This is also the case for our example, i.e., the population of all Haskell developers in the world. In order to make a study practically executable, we need to select a sample from the population. There are two principal ways to attain this: probability and non-probability sampling.
In probability sampling, every member (or item) of the population has a known, computable probability of being selected for the sample. For this, we ideally need a list of all members of the population. If it is not available, an imperfect sampling frame can be used, listing a large portion of the population. Two of the most common probability sampling strategies are:
When a list of all population members or a sampling frame is not available, we need to use non-probability sampling. Some of the commonly used strategies are:
Before designing questions in a survey, it is necessary to carefully consider what we would like to find out. Each survey question should contribute to answering one of our research questions or confirming our hypotheses.
Some RQs about simple variables and facts can be directly transformed into an item in a questionnaire. For example, if we want to know what IDEs Haskell programmers use, we can simply ask: “What IDE do you use?”
However, we often want to study abstract, multi-dimensional constructs, which cannot be directly measured or observed. For instance, asking “What is your cognitive load when merging Git commits?” does not make much sense. Constructs such as cognitive load need to be operationalized into measurable items. In the case of surveys, one multi-dimensional construct is usually operationalized in a set of multiple related questions, either standardized or designed specifically for the given study by a researcher. In our example, the construct of cognitive load could be operationalized using the standardized NASA Task Load Index (TLX).
The questions asked in a survey can be categorized into two main groups: closed-ended and open-ended questions.
Closed-ended questions include numeric, single-choice (including the Likert scale), multiple-choice, item-sorting (ranking), and similar questions that can be directly analyzed quantitatively. They are useful to answer many kinds of RQs, mainly about counts, frequencies, proportions, such as: What is the average value of X? What proportion of X is Y? Considering multiple questions at once, we can also ask: Are X and Y correlated?
Open-ended questions require free-form texts, images, sounds or other unstructured data as answers. After qualitative analysis, they can be used to answer many kinds of “how”, “why”, “what”, and other RQs, e.g.: What is the users’ attitude to X? Why do people do X? How could X be improved?
Sending a survey to hundreds of subjects and then realizing the most important questions was ambiguous is really unpleasant. Before starting the actual response collection, first try the survey on a small group of people. This group does not have to be representative, and it is usually obtained by convenience sampling. Responses from the pilot testing will not be included in the final analysis.
During the pilot testing, we should focus on the clarity of the questions, appropriateness of the response scales, the time required to complete the survey, and technical issues. We can then modify the survey according to the feedback if necessary.
Pilot testing is often applied also to other research methods involving human participants, especially controlled experiments.
If we used a sampling and recruitment method that involved invitations of particular persons, most likely not all of them actually filled in and submitted the questionnaire. It is thus necessary to mention the response rate in the report.
The questionnaire form should be configured to validate the inputs whenever possible, such as forbidding empty answers for mandatory questions. Nevertheless, the received responses should be checked for signs of invalid responses, such as free-form answers containing nonsensical texts or combinations of answers to two questions that do not make sense. There are three basic options to deal with invalid responses:
Whatever the choice was, it has to be clearly documented in the report, including the specific counts of invalid responses.
The analysis and reporting of the results depend on the nature of the questions. Open-ended questions require specialized analyses, such as qualitative coding, which we will describe in the next section about interviews. Closed-ended questions are usually reported using descriptive or inferential statistics.
When choosing descriptive statistics, we can report means, medians, and standard deviations of percentages or absolute frequencies. With non-probability sampling, we should generally not claim representativeness for the whole population. For instance, you cannot say “40% of all C# developers use lambda expressions” if you surveyed only programmers from one company.
A large variety of inferential statistics can be computed from survey results. Some of the most common ones include the calculation of confidence intervals, differences between groups, and relationships between variables.
When the participants were selected using probability sampling, we typically report confidence intervals for individual variables. A confidence interval is a range of values that likely contains the true value, e.g.: “40% of subjects selected this option (95% confidence interval is +/-4%)”. It consists of the definition of a confidence level and a margin of error. The confidence level, usually 95% or 99%, tells us that if we repeated the random sampling infinitely, the given percentage of intervals would contain the true value. The given interval is defined by the margin of error, e.g., +/-4% in our example.
Instead of post-hoc reporting of confidence intervals only to find that they are too broad because of an insufficient sample size, we can calculate the required sample size before starting the recruitment of participants. This can be accomplished with statistical libraries or an online sample size calculator for simple random sampling.
Differences between groups can be calculated when we have a categorical variable representing groups (e.g., the role: a manager, programmer, or tester) and another concept of interest (such as the number of lines of code written per day) captured in a survey. Then we can compute averages of the groups and determine whether the differences are statistically significant using an appropriate test, which is a procedure similar to the one used in controlled experiments (Section 5.6). Of course, unless we include confounding factors in the survey and control for them, we cannot show causation.
Other relationships between variables captured in the survey can be computed too, such as correlation between two numeric variables. We will demonstrate this on a made-up example.
We have a hypothesis that developers with more years of experience write more lines of code per day. Suppose we collected data using a survey.
A web questionnaire was designed, containing only two questions, both mandatory:
Pilot testing with three subjects did not reveal any problems. Convenience sampling was used; an invitation to participate in the survey was sent to 30 developers in four software companies in one city. Two weeks were allocated for response collection. Twenty-one developers filled the questionnaire, resulting in a response rate of 70%. Two responses were excluded since they reported more than 100 years of experience.
results <- read.csv("data/survey.csv", header = TRUE)
plot(lines ~ experience, results,
xlab = "experience (years)",
ylab = "lines of code/day")
We calculate Spearman’s \(\rho\), which is a correlation coefficient usable for monotonic (including non-linear) relationships:
cor(results$lines, results$experience, method = "spearman")[1] -0.9632526The results indicate a strong negative correlation (-0.96). The hypothesis was not confirmed; on the contrary, according to our results, more experienced developers tend to write fewer lines of code per day. Our study is limited by an important construct validity threat, which is manual, approximate reporting of the lines of code written per day instead of automated measurement in an IDE. Obtaining responses from companies in one city is an external validity threat.
For more realistic and high-quality examples of survey research studies, we recommend papers by Inal et al. (2020) and Begel & Zimmermann (2014).
An interview is a session focused on a specific topic when the researcher asks questions and the interviewee answers. An interview study is usually performed as a sequence of multiple interviews with one researcher and one participant. An interview with multiple subjects at the same time is called a focus group. Typical RQs answered by interviews and focus groups are “how” and “why” questions: How do people perform some activity? Why do they perform it?
We know three main types of interviews:
Open-ended questions are often asked. The interview is often sound-recorded, with the participant’s permission. In addition to or instead of recording, the researcher can take written notes. After the interviews, the recordings are transcribed.
The transcripts are analyzed using a process called qualitative coding. It is a form of text analysis, applicable also for qualitative methods other than interviews. The researcher reads the text and labels selected segments with tags called codes that characterize each segment in some way. Let us consider the following text:
When I connect to a meeting, I always forget to turn on the microphone. I usually talk for a minute straight until I realize it. …
A researcher usually starts with open coding, which is the assignment of initial codes without choosing from a predefined list or applying strict rules. For instance, we assign the code “forgetting turning on microphone” to the first sentence. To emphasize the interviewee’s emotions, we could assign an in vivo code “talk for a minute straight”, citing the used words exactly, to the second sentence.
After open coding, we could continue with axial coding that groups related codes into one. For example, “forgetting turning on microphone” and “forgetting turning on camera” could be both assigned the code “disabled input devices”. Finally, we can perform selective coding by choosing a central topic and relating codes to this topic.
A more elaborate example by Graziotin et al. illustrates qualitative coding phases for studies about the happiness of software developers. Here, the codes are assigned by three researchers separately and then merged. As examples of papers using qualitative coding for interview data, we can mention the one by Krause et al. (2025) or Habiba et al. (2024).
To determine how many participants are needed to maximize the validity of a study, quantitative studies use statistical techniques, such as power analysis. However, in qualitative research, such as interview studies, a completely different approach is necessary. Here we stop collecting data when data saturation is reached. Data saturation occurs when adding more participants does not provide new topics (e.g., codes in qualitative coding) anymore and information starts repeating to a great degree. Data saturation is discussed in detail by Saunders et al. (2018).
Participants of surveys and interviews often supply imprecise data, particularly related to past events. This problem can be solved by using a data collection method called a diary. A participant performs tasks in natural settings and writes notes into a diary about selected events continually as they are occurring. Diaries alone or with a connection to other data collection methods help answer RQs such as: How does X occur? How often does X occur? What does a person X typically do?
A participant can write a record to the diary:
In observation studies, the researcher analyzes the actions performed by participants during tasks. Specific details depend upon the nature of the task. If the goal is to assess the usability or other properties of some software, the screen contents are often captured in the form of a video. This could answer the “how” questions perfectly, but to find out why certain actions were performed, we should complement it with a think-aloud protocol. Here, in addition to performing the task, the participant also comments on the reasons, intentions, and other ideas behind the actions.
Studies aiming at understanding cognitive load, physical effort or similar characteristics, can utilize biometric measurement in addition to the participants’ observation. Eye tracking, movement and position tracking, and brain activity monitoring using EEG (electroencephalography) or fNIRS (functional near-infrared spectroscopy) pertain to this category.
A particularly interesting technique called the Wizard of Oz allows us to perform an observation study with a system or approach which has not yet been developed. Instead of a computer, a human responds to the participant’s input, simulating the output that we would expect from the system if it had been implemented. It is useful to obtain qualitative data in the early exploratory phases of a research project.
Multiple methods and data collection or analysis techniques can be combined to form a larger methodological approach. We will mention a few of them in this section.
A case study is an in-depth investigation of a small number of cases in their natural context. A case is a unit of analysis, e.g., a project, team, organization, or technology, bounded by some criteria, such as time, place, or other properties. Case studies use multiple data sources and predominantly qualitative analysis. They are not generalizable in a statistical sense but nevertheless can provide interesting insights about a phenomenon, transferable to other contexts. There are multiple types of case studies. For example, an exploratory case study could be used to find which challenges graphical user interface designers face. We would visit one or two companies, observe them for some time and take notes. Then we would interview them about their problems. In a demonstration case study, we could offer your newly designed tool to a small group of developers in one organization to use it for real-world work. Then we would ask them for feedback.
Ethnography is a combination of observation, interviews and typically also active participation of the researcher with the study subjects directly in their natural settings. Phenomenology studies the lived experiences of participants, focusing on a certain phenomenon and usually without active participation of a researcher. Finally, a grounded theory uses a variety of methods and data sources to build a new theory from data.